MAP Professional Development Resource
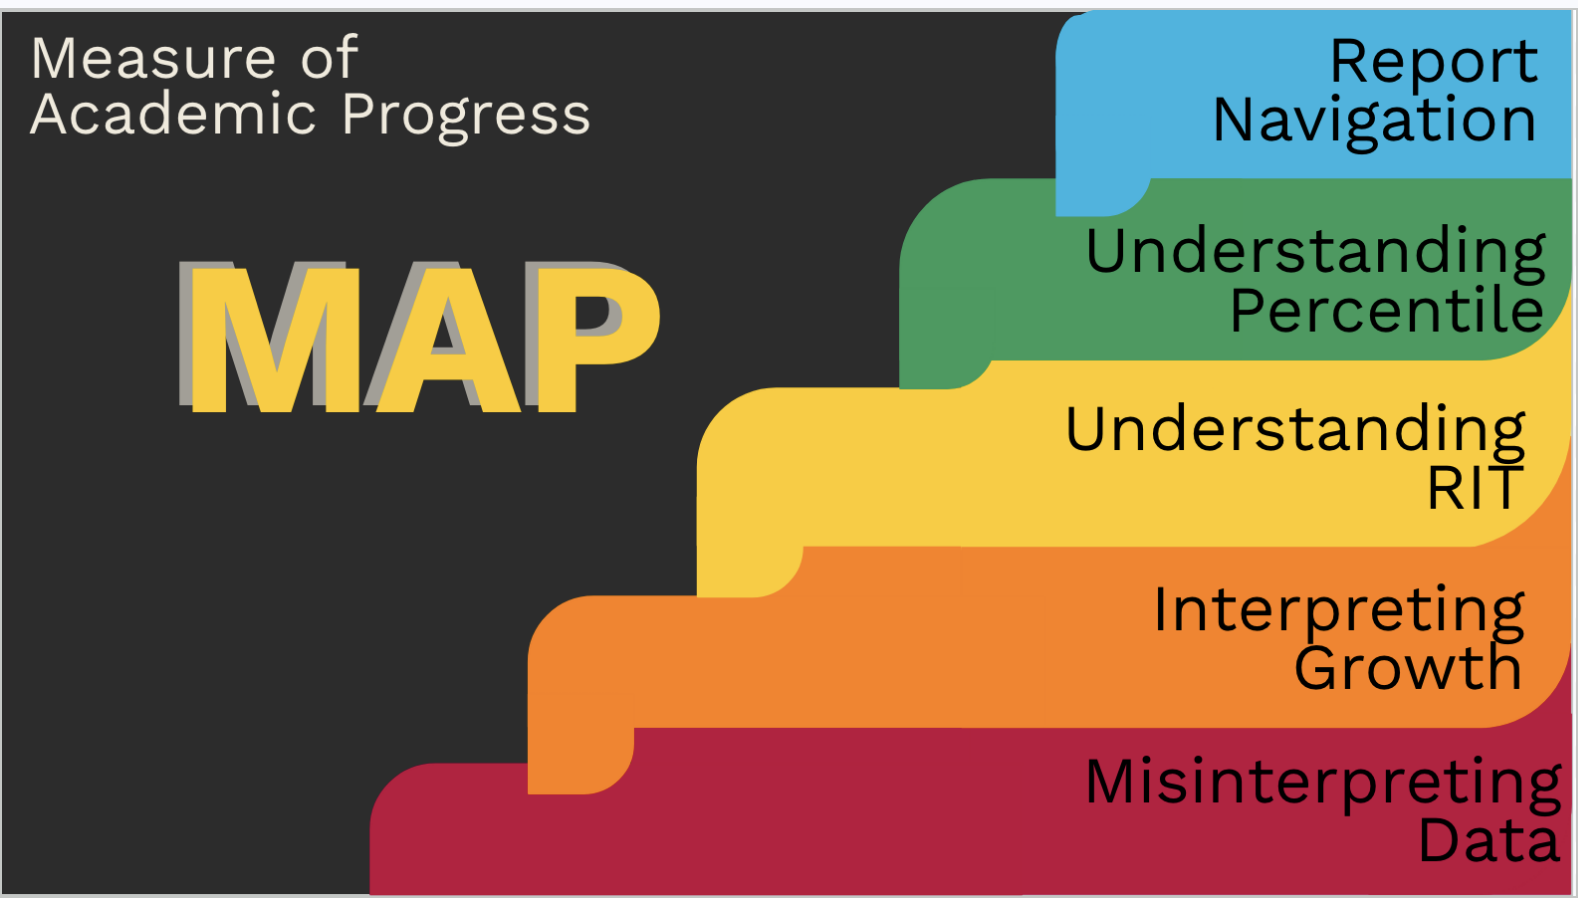
Click on the image above to navigate to the MAP Resource
This project is a full professional development resource designed to build teacher capacity around NWEA MAP data interpretation. Built in Google Slides with a clickable navigation system, it functions both as a facilitated learning experience and a self-guided reference. It was designed, built, and led by me and has even been shared beyond our building.
Growth Through Challenge
Courage looks like staying in the room
The hardest part of planning this professional development wasn't the content. The most challenging aspect was knowing how teachers felt about MAP testing and then figuring out how to approach the conversation in a meaningful, productive way. I wanted to be careful, beginning with the basics of MAP terminology, building capacity and understanding from there, all while ensuring teachers felt respected for where they were in their understanding. Leading this required a specific kind of courage. It's through projects like this that I've learned instructional leadership means prioritizing students over comfort. Doing that with warmth and curiosity rather than judgment is what makes it sustainable.
Leadership Strengths // Modeling
Complexity becomes accessible when leaders design for clarity
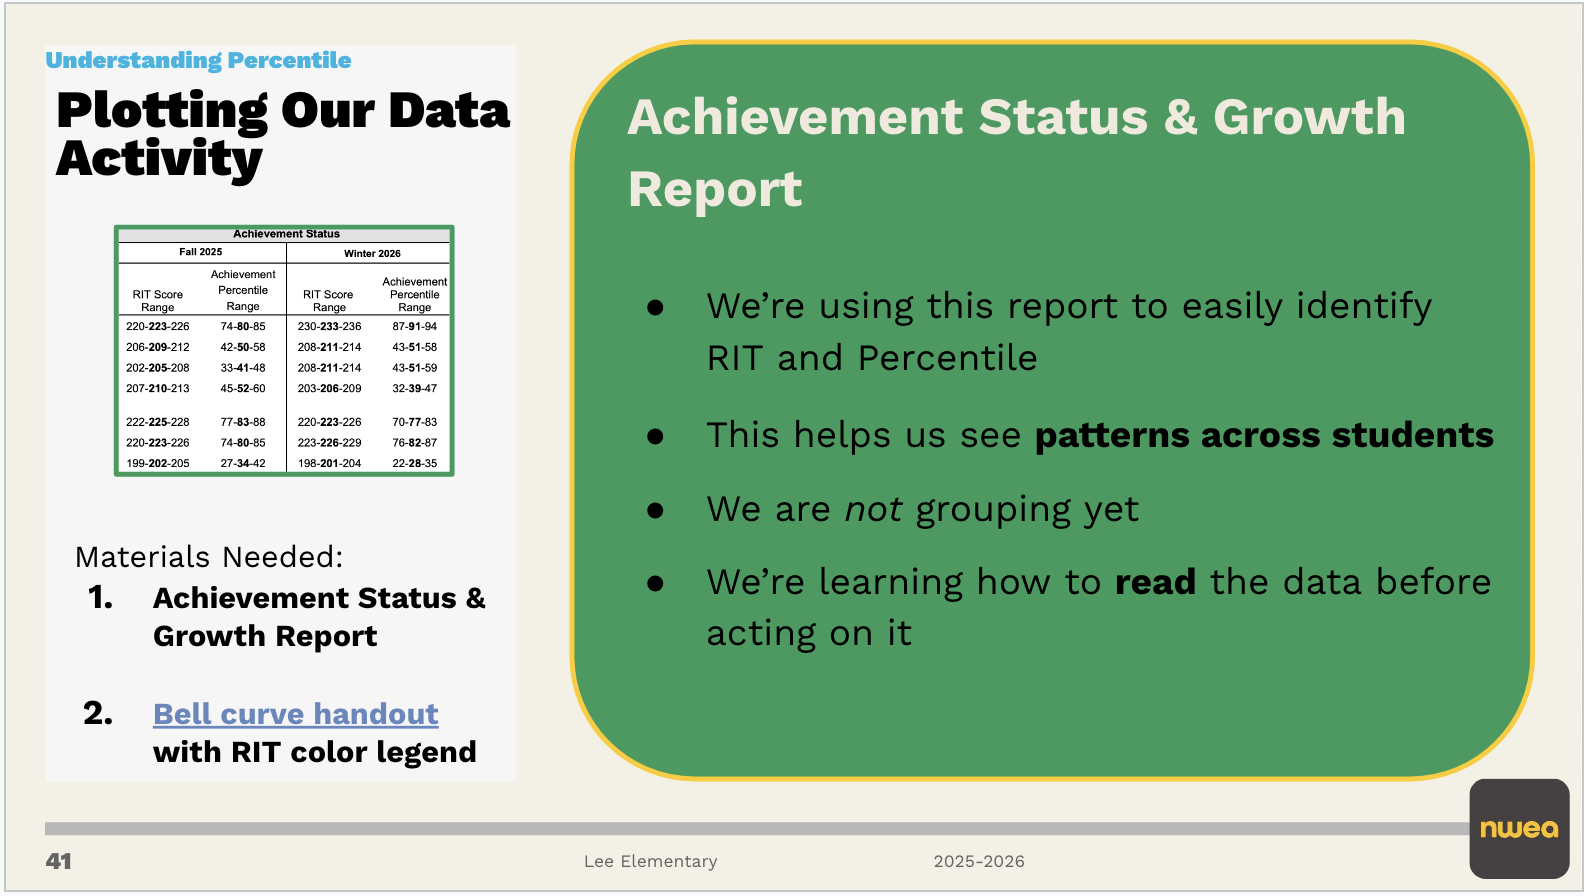
This project affirmed my ability to take something technically complex and make it usable while simultaneously building teachers' confidence. I didn't want MAP data to be a lecture. I built interactive activities using real student data to support relevancy, then added more elements to serve as a self-guided resource, clearly organized around the questions teachers actually ask. Change lasts when teachers leave having shifted their thinking through dialogue or an activity they were part of. That was the standard I held myself to across every session.
This project would not have taken the shape it did without my principal's partnership. When she identified it as an opportunity for me to lead, she wasn't just offering me a task. She was extending trust and communicating belief in my capacity to design and facilitate something meaningful for our staff. Her involvement modeled something important about how good administrators think. She saw a staff need, identified someone with both the knowledge and the developmental readiness to address it, and created the conditions for that person to lead. I am carrying that forward. The cross-district reach of this project offered a second modeling moment. Leadership doesn't have to stay inside your own walls to create impact. Sharing this resource with a teacher in another district, which then reached a TOSA supporting multiple schools, is a reminder that work done carefully and generously travels further than you plan.
Reflective Revisit // Next Steps
The data becomes instructional the moment it becomes personal
If I were to return to this project with fresh eyes, the thing I would examine most critically is the gap between understanding data and acting on data. The resource I built does an effective job of helping teachers accurately interpret what MAP scores mean. That foundation is necessary and I believe it was largely successful, but interpretation is not the same as application. The moment when the data becomes personal is where instructional decision-making begins. I want to build more experiences that live in that space, structured activities where teachers use their actual class data to identify next steps, plan entry points, and set student-facing goals that mean something.
The longer vision is a living resource, one that teachers return to across years as NWEA updates norms data and our practices evolve. Not a one-time training artifact, but something that grows with us.
TSPC Standards Alignment
Each project in this portfolio is intentionally connected to Oregon's Principal License Standards, demonstrating how my practicum experiences built real leadership readiness across multiple domains.
By clicking the link below, you’ll be directed to the government website for a full description of each standard of practice.
-
I designed this professional development because I kept watching teachers read MAP scores and immediately draw conclusions about what kids couldn't do. When teachers understand that low scores reflect instructional opportunity rather than student limitation, high expectations stop being something we post on walls. They become something we plan toward.
-
Data misread through a deficit lens doesn't stay abstract. It shows up in which students get pulled for intervention, which get referred for testing, and which get written off before winter break. This project built teachers' capacity to recognize that pattern and interrupt it by reframing what assessment data is actually telling us about our instruction, not our kids.
-
Designing and leading PD that increases data literacy is instructional leadership in direct action. Teachers left able to distinguish RIT from percentile, navigate reports with purpose, and plan next steps rather than draw fixed conclusions about kids. That shift in how teachers read data changes what happens in the classroom.
-
Families in this building were being told their child was "in the green" with no real explanation of what that meant. When teachers can translate MAP scores into clear, accurate language, families stop being passive recipients of numbers they can't interpret. They become informed partners. That is a different kind of relationship, and it starts with what teachers know how to say.